How to Use Google Analytics’ Lifetime Value Report to Sell to More Your Existing Customers

If you had to pick only one metric to help you grow your business, what would you choose?
You might think that conversion rate optimization metrics would be the most important since they typically affect your bottom line the most, right?
But if I had to pick just one metric, I would choose lifetime value.
Above all else, this metric can help you sell better, optimize more, and create a better overall user experience.
But up until recently, finding out your customer’s lifetime value involved complex equations that needed to be done on a regular basis in order to get useful data.
Simply put, the process was mind-numbing.
Your only other alternative was to pay for a service that could track and calculate everything for you, but that wasn’t always budget-friendly for small businesses and startups.
But since 2017, Google Analytics has been allowing users to experiment with a free lifetime value report.
That means that anyone can now use this useful metric.
So I want to help you understand and use your lifetime value report in a way that enables you to find better ways to sell to your existing customers.
But first, it’s important to know how exactly lifetime value fits into the bigger picture of brand growth.
Why lifetime value is so vital
Lifetime value is a metric that takes a vast amount of high-level data and turns it into something more actionable.
But somewhat, unfortunately, that also means that lifetime value is inherently more nuanced than most metrics you may be used to seeing.
This metric attempts to project the amount of revenue a single customer can potentially spend over the course of their interaction with a brand.
Another way to look at it is to think of it as the value of a customer over the course of every phase of their interaction with a business as it relates to various revenue building opportunities.
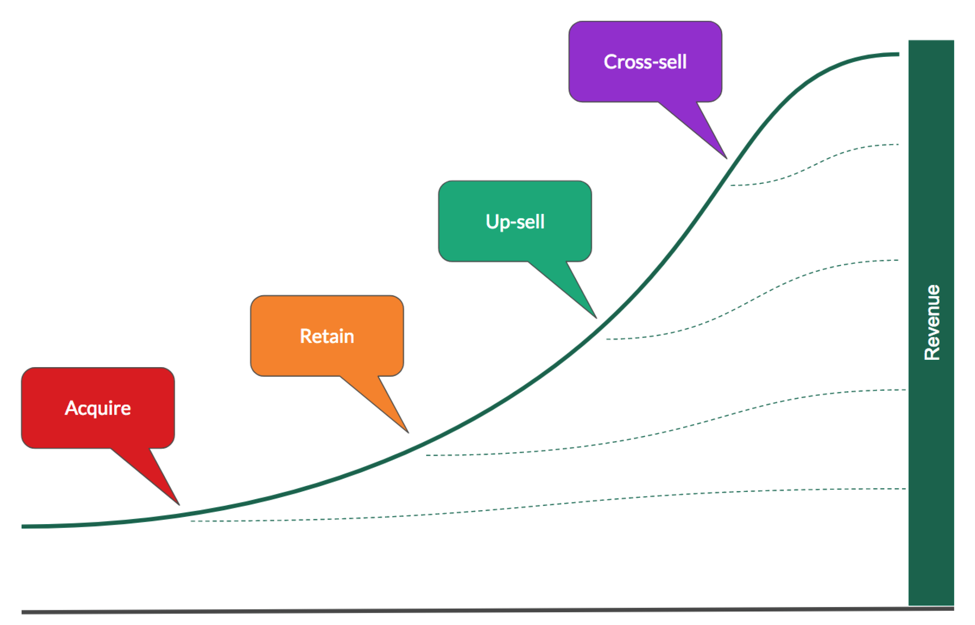
Your lifetime value will be different for customers that make it into each phase, which creates a layered effect to your data.
The purpose of your brand is to find data points that help you improve your product and marketing.
In turn, this can reduce churn in each of these phases and boost your revenue in the long-term.
But why would you need this data?
Aren’t traditional metrics enough to help you make these decisions?
Yes and no.
Basic metrics aren’t always the most reliable method of proving actual ROI, and can sometimes distract you from the data that will help you better optimize your customer experience.
For example, A/B tests can lie to you if you aren’t careful.
You may end up only testing your biases, and you may not gather enough data to achieve statistical significance.
That, in turn, leads to the problem of a premature testing dilemma like this one:
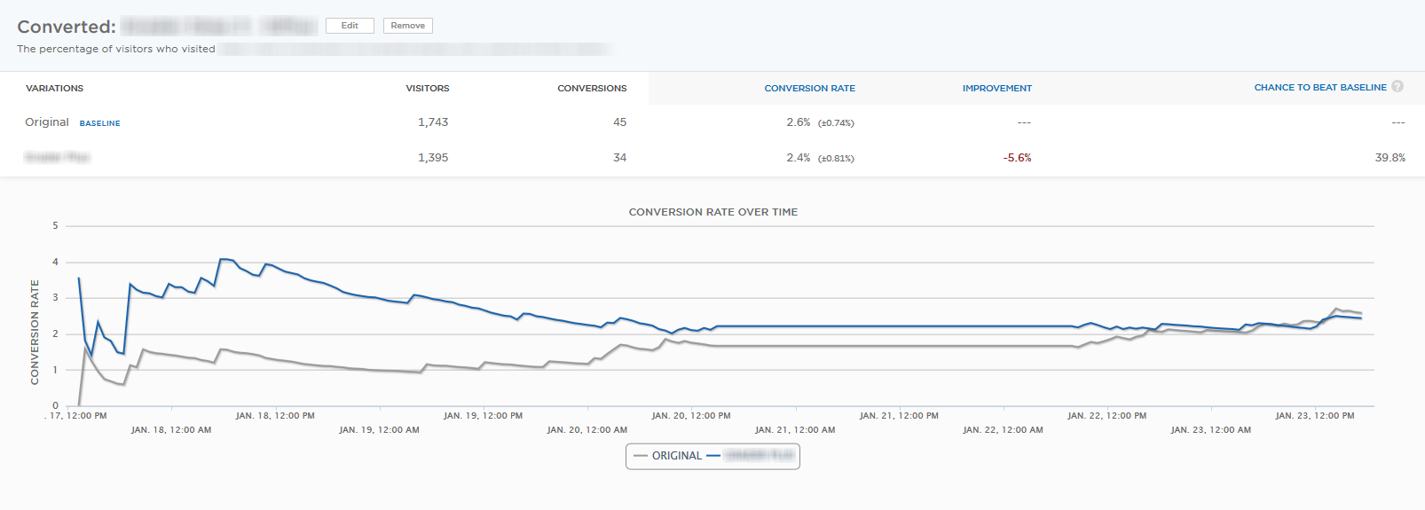
In many cases, brands will take the early results of its A/B tests or data gathering and see what it believes is an improvement.
Thinking they’ve discovered a new hack that will always help their brand, they end their testing and don’t wait to see if the change lasts.
In the image above, it only took a few months for the control test on the bottom to surpass the newer test that saw short-term success.
A short-term solution may look good, but it’s easy to let early success cloud your vision when interpreting your data.
And then you have to remember that merely having a high conversion rate doesn’t mean you have high-quality and qualified leads.
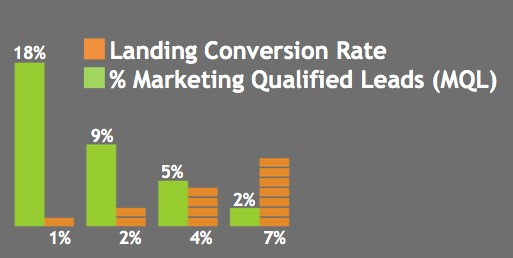
You could have astronomically high conversions on a landing page or blog post, but if all of those leads are dropping out before purchasing something, then your data is useless.
Instead, you need to find a way to correlate your metrics to their ultimate outcome and make changes from that data set.
But then it gets even more complicated.
On top of premature testing dilemmas and unprofitable conversion rates, you have to remember that different industries need to interpret its data in different lights.
For example, if you use paid ads to drive traffic, remarket, and ultimately win customers, then your cost-per-click will vary greatly and skew the viability of some marketing options.
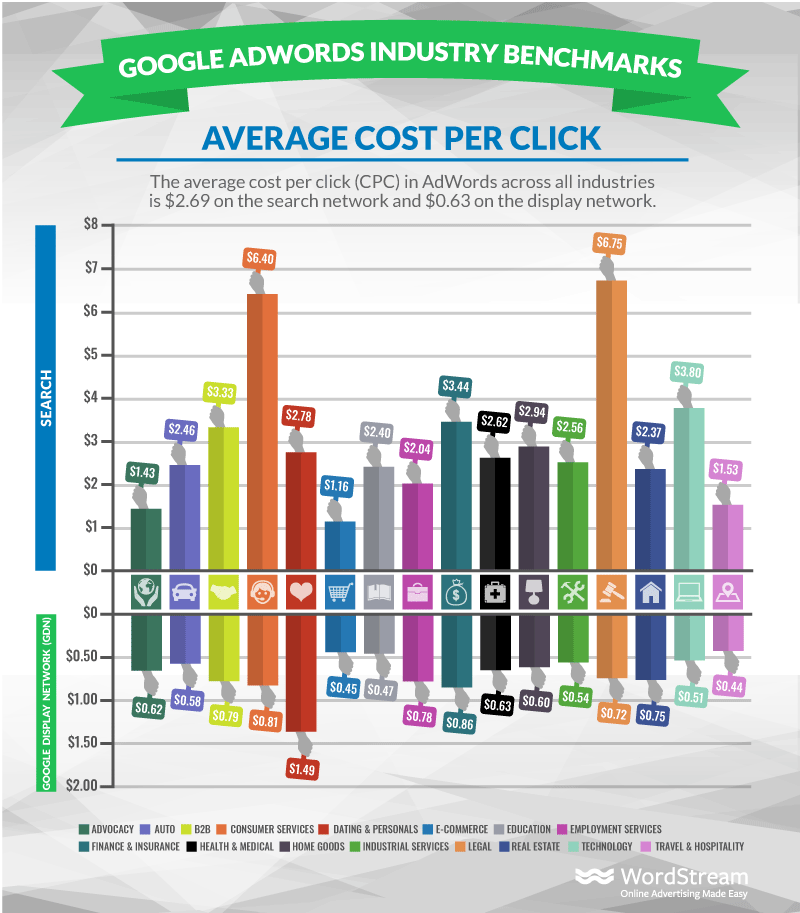
You may see a reasonable conversion rate for your industry, but if you can’t link this type of cost to proven revenue, then you can ultimately use your data to run your business into the ground.
All of this data prompts you to make a decision, but if you’re not careful, it could point you in the wrong direction.
You have to ask one question:
If your data doesn’t point to a proven lead, sale, or profitable end goal, then how much is that data telling you?
Once again, that’s where lifetime value can provide clarity.
Lifetime value is an interaction of data that will show you just how much effort you need to put into getting and keeping a customer.

By interpreting your smaller data points through the lifetime value lens, you provide yourself with data that will help you make money more efficiently.
In the words of PMGBrands founder and CEO George Popstefanov, lifetime value can:
…complement the right first-party data that a brand has with a partner’s signals to give a very customized message and experience to customers with high accuracy.
That means you’re taking high-level data and finding a practical application for it.
More specifically, you’re taking data from your already existing customers and finding out how you can sell even better to them.
And now that Google Analytics provides a free Lifetime Value Report, it’s easier than ever to gather data that enables businesses to understand the value of a customer truly.
Winning new customers is excellent, but lifetime value focuses on providing real data that lets you sell to all potential customers, including those that already exist.
And plenty of studies have shown that your current customers are by far your most profitable audience.
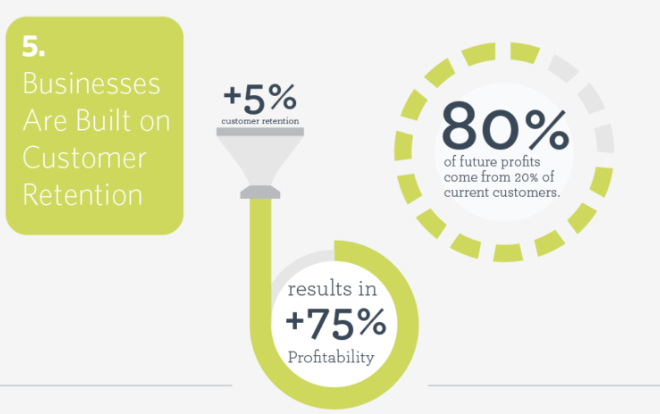
So not only will you sell better by understanding and using your lifetime value, you can build the future of your business on this single metric.
Or in other words, increasing lifetime value equals more revenue and better customers in the long run.
And now that Google Analytics allows you to access a free version of your lifetime value, most of the number crunching is done for you.
All you have to do is know how to use the data given to you.
So I want to show you how to use Google Analytics to find this data on your website.
Then, I want to give you some ideas for how you can use this data to improve your marketing and boost the value of your existing customers.
How to create a lifetime value report in Google Analytics
Now that you know why the lifetime value of your customer is so vital, I want to show you where and how you can pull up this data in your own Analytics dashboard.
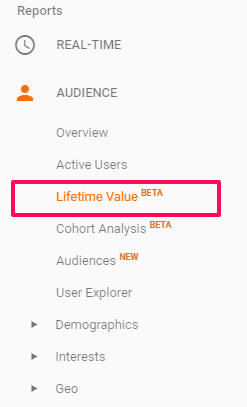
To start, pull up your Google Analytics dashboard and find the Audience tab.
From there, select the option that says Lifetime Value.
From this dashboard, you have a variety of data points that fall under the umbrella of lifetime value.
To start gathering your data, there will be a few different areas you’ll need to choose your LTV Metric and Acquisition Date Range.
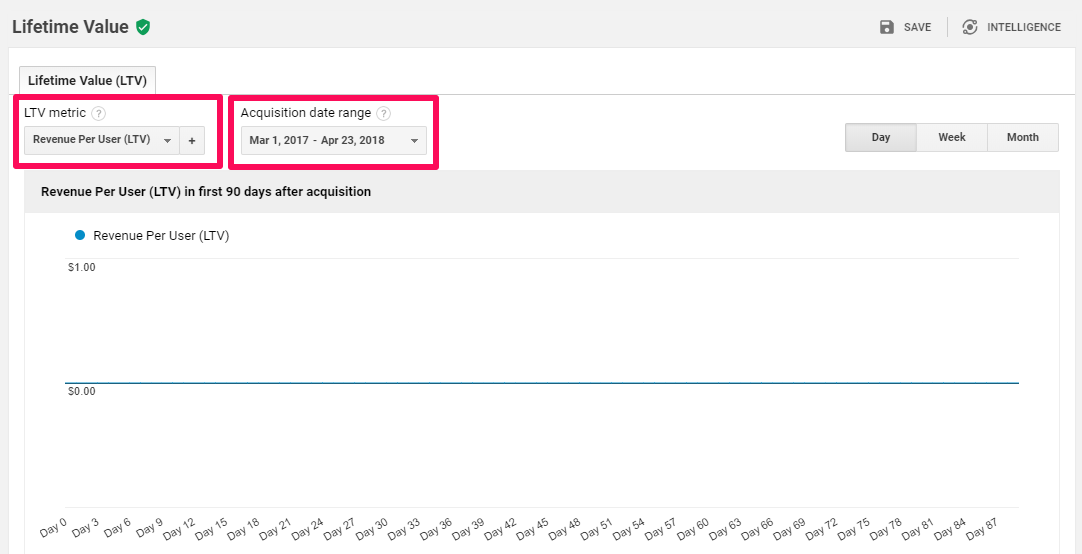
These will generate the specific metric displayed by Analytics and will allow you to project data from both current and past activity.
I’ll walk you through how to set up each to get the various data available to you.
First of all, you need to establish a cohort for your data by selecting an Acquisition Date Range.
This setting allows you to pull data from customers and website visitors within a specified period of time.
Analytics will then base its lifetime value projections off of those customers.
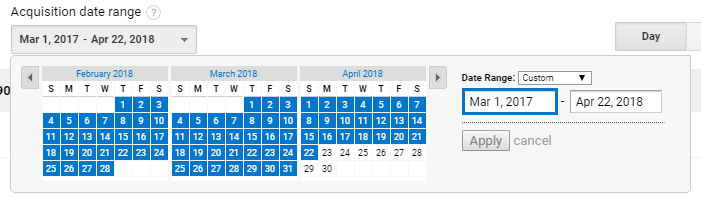
This is where you’ll find the most flexibility in your data, as you’ll be able to evaluate past cohorts with present projections to see how lifetime value has changed over time.
Adjusting your Acquisition Date Range will allow you to see how this vital metric is affected as you experiment and adapt your marketing.
Or, if you run something like a Black Friday sale, this can let you establish a cohort and see how customers from events like that vary from day-to-day customers.
Analytics lets you see as narrow or as wide a range as possible for your data.
So If you want to see your lifetime value for an entire year or just a week, you can modify as necessary.
Then once you’ve established your cohort, you’ll need to select a lifetime value metric for Google Analytics to calculate.
The default screen will show you Revenue Per User, but you have six different options:
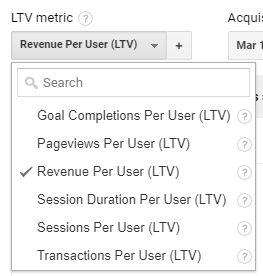
Each of these metrics will display a projected 90-day value depending on how your site has performed over a selected period of time.
The first option will require you to set up a custom goal in order to track.
The second option, Pageviews Per Viewer, gives you an estimate of how many additional page views your acquired customers are likely to provide.
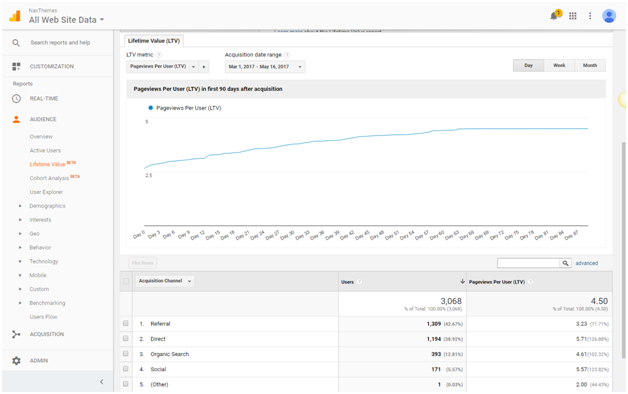
This can allow you greater insight into how many of your unique pageviews are repeat visitors or customers.
So if a blog post or page is getting a lot of repeat viewership from your audience, you may need to adjust and create a selling opportunity.
Your next option is Revenue Per User, which projects how much additional money on average your users will likely spend in the next 90 days.
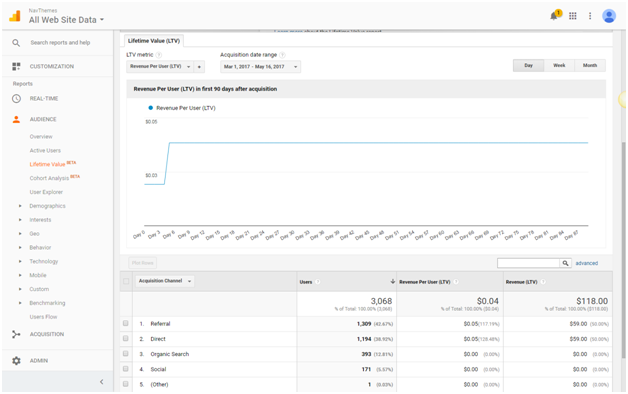
In this instance, you definitely want to see growth in the long-term.
Using your first cohort as a baseline, you can see if your upsell or remarketing efforts are paying off with real revenue growth.
The next option is Session Duration Per User, which again gives you actionable data about how users are interacting with your site.
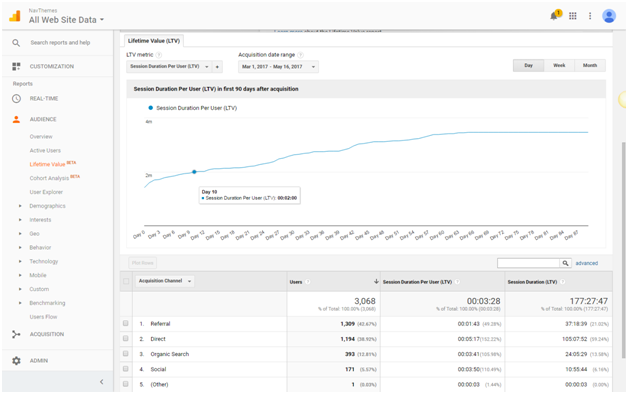
If users are only spending a few seconds on your site, then you have a lot of optimization work to do.
You can also use this data to inform content decisions by looking at before and after effects of publishing longer or shorter pieces.
Next is Sessions Per User, which projects how many more times a visitor user will return to your site in the next 90 days.
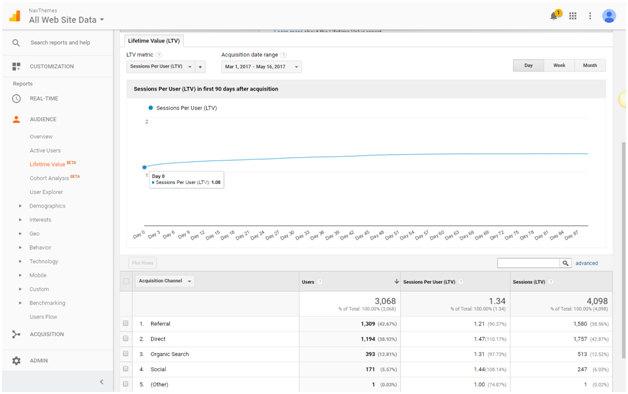
Anything above a one, in this case, means you have some viewers returning, but again finding ways to see growth in this metric can mean better selling opportunities.
And last but not least, you have Transactions Per User, which tells you roughly how many times your cohort’s user is likely to make another purchase.
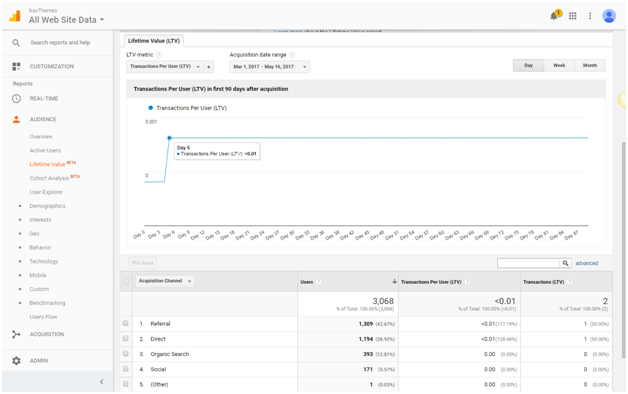
Since more transactions usually mean more revenue, this metric can show you just how well you’re doing at winning repeat customers.
If you’re flatlined at zero or not seeing any growth, then you need to look into methods that will help you sell to your existing audience.
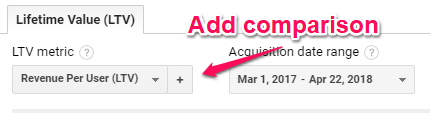
Now that you understand each of these metrics, I want to show you the final wrinkle that Analytics allows you to insert in your data.
By clicking the plus symbol next to your initial metric, you can add a comparison metric to see how these projections interact.
You’ll see the same list of metrics as before:
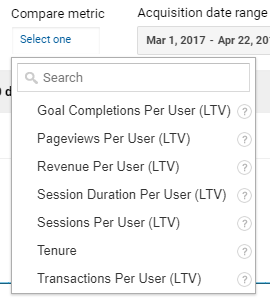
Now you’ll be able to see how all of your data interact based on the cohort and metrics you’ve selected.
But how do you use this data to help inform your marketing decisions and sell to your existing customer?
That’s what I want to show you next.
How to use this data to fine-tune your marketing
Now that you know how to find the different data projections available to you, I want to show you which data is most helpful and how you can use it.
Analytics breaks down your results into two different areas.
The first shows a graph of your 90-day projection of lifetime value based on the Acquisition Date Range as we’ve seen in the examples above.
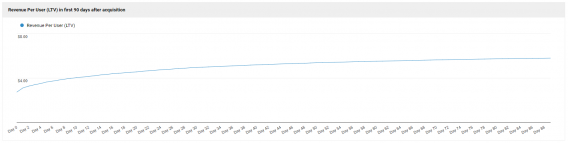
This gives you a basic idea of how much growth you can expect from a particular cohort over the next 90 day period.
But you also have a second set of data below the fold that provides even more actionable data than the graph.
The second group of data is a graph that breaks down where your acquisitions have come from and which channel produced the greatest revenue.
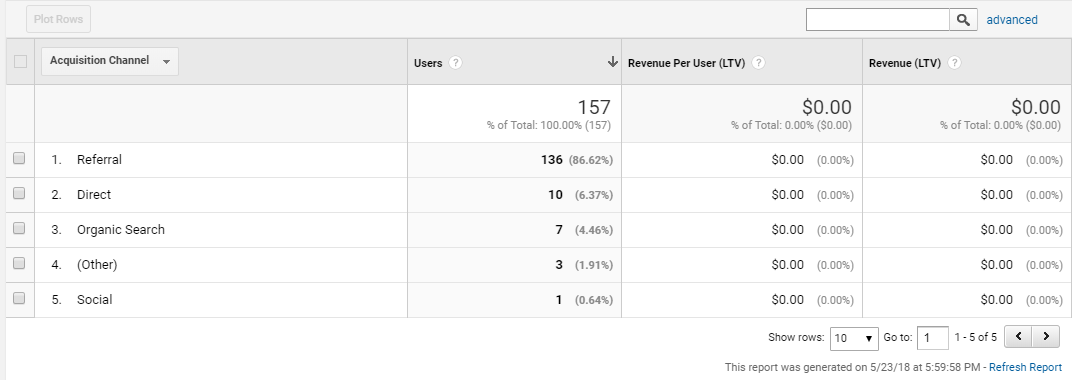
You’ll be able to see where your visitors are coming from and how much revenue each user and channel generates on average.
You can also find out how big the pool of acquired users is for your Acquisition Date Range.
And you get a breakdown per channel of the LTV Metric you’re analyzing.
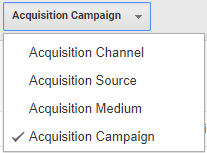
From this section, you can also change the graph being displayed to see data broken down by Source, Medium, or Campaign.
The various combinations of data and comparative metrics can allow you to optimize your marketing in a variety of ways.
As you’re about to see, you can use this information to perform experiments on your website, email, and social media in ways that create better selling opportunities to existing customers.
Simply by running a Revenue Per User report, you can see which channels and campaigns are the most profitable to your brand as proven by this brand’s data:
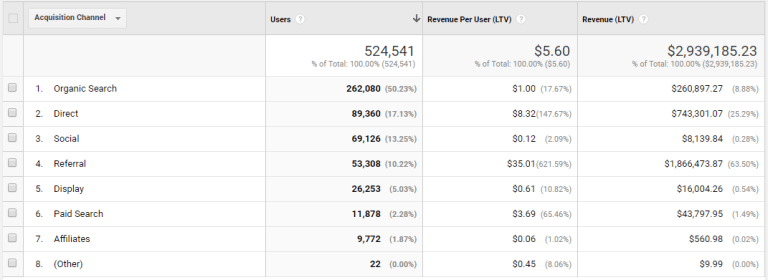
In this instance, its organic search traffic by far outstripped other channels in terms of traffic, but the average revenue per user is one dollar.
Its second most popular acquisition channel is direct traffic at an average of $8.32 per user, which adds up to almost three times the revenue from organic search.
If it were to simply base its marketing decisions off of which channel acquired the most users, it would miss out on where the most revenue came from.
And from here, it can change the graph to display its Acquisition Campaign in order to see which site, ad, or effort is providing the most traffic and revenue.
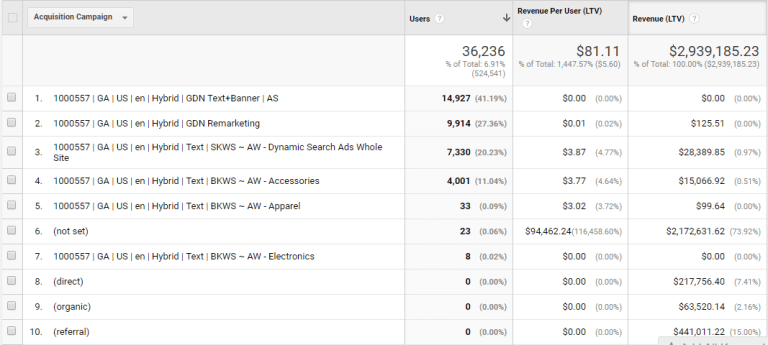
Once again, the top driver of users isn’t the best seller.
In fact, if they’re spending money on that campaign, they’re quite clearly losing money because no revenue has been generated.
But the point here is to show you how you can use this data to sell to your existing customer.
And the answer to that is fairly simple.
By using this data to dial in your most profitable sources, you know exactly how profitable your emails, remarketing, or other retention efforts are.
And once you find the most profitable approach to retain, upsell, and cross-sell, you can focus your efforts on improving your customer’s lifetime value on that channel.
In the example above, referrals are the primary driver of revenue.
That creates an opportunity to continue experimenting with referral programs for retention, like this example from Dropbox:

It incentivizes its existing customer to stay by asking for a referral.
This also allows you to test the validity of efforts like revival emails like this one:

All you have to do is create a cohort of customers to use as a baseline for your data before you start these campaigns.
Then, once you send out your email or start your experiment, you can create a new cohort for the duration of the campaign.
This lets you track how many customers come back directly because of your campaign, which in turn gives you an accurate assessment of how effective your effort is.
And this is usable for any brand in just about any format.
For example, SAAS companies can use lifetime value to improve its product and improve customer onboarding sequence.
You can experiment with how often you contact customers, the validity of online chats, or even use this information to improve your product.
By measuring your lifetime value, you know exactly what’s working and what’s not.
In one case study, a brand called The Cloud Alchemist was able to double the lifetime value of its customers simply by testing and optimizing loyalty campaigns.
It created personalized emails like this:
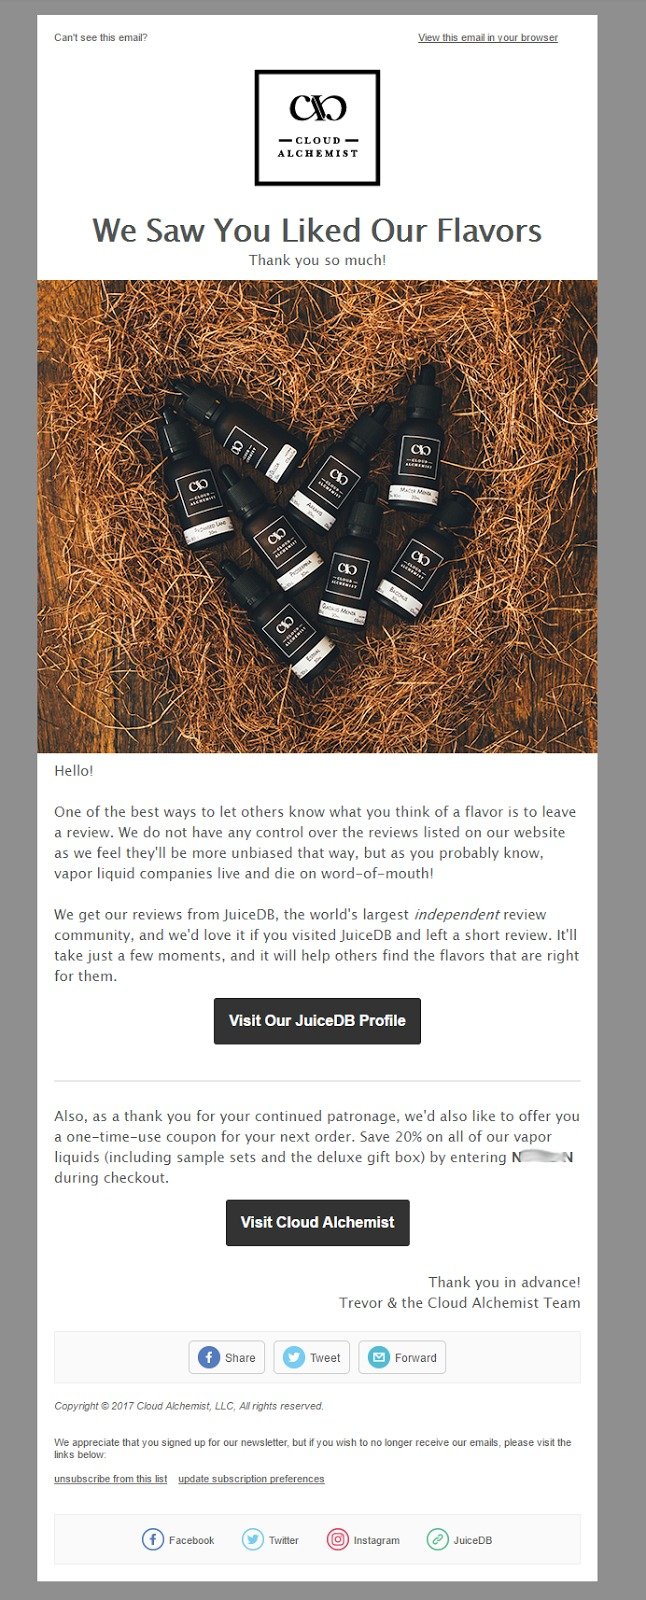
And even tested which types of rewards resonated with its existing customers.

By focusing on lifetime value and testing its efforts over time, it saw a dramatic increase in revenue from its existing customer base.
And this is a valid approach for any brand.
Use Google Analytics’ lifetime value report to find out which channels are bringing you customers, and then use that information to sell more.
As you experiment, your brand will start to see actual growth based on proven revenue instead of guesswork.
Conclusion
The lifetime value of your customers is by far one of the most critical metrics in your arsenal.
It not only lets you know how your marketing and sales are performing right now, but it also gives you a reliable window into how your brand can grow in the future.
Unlike the other metrics in your Analytics, it can accurately project your performance over a 90 day period.
You’ll be able to mitigate the potential pitfalls of premature testing decisions, and even see if efforts from paid advertising are providing a positive ROI.
With this information, you can experiment with how you sell and upsell to your existing customers.
By focusing on the channels that provide the most valuable leads, you can build retention campaigns that better meet your audience’s needs over time.
And with Analytics, it’s easy to setup your lifetime value report.
For a little effort, you can have data that truly allows your brand to retain and upsell to your most profitable audience.
You can use this information to compare the before and after results of specific campaigns via email, social media, or even customer onboarding efforts.
As time goes on, you’ll be able to fine-tune your marketing and make decisions off of data that improve your marketing ROI.
What experiments have you conducted that increased your brand’s lifetime value?
The post How to Use Google Analytics’ Lifetime Value Report to Sell to More Your Existing Customers appeared first on Neil Patel.
from Tumblr https://ift.tt/2sktJbi


Comments
Post a Comment